FIND
Parking/Unit Ratio (Number of Stalls/Unit)
>0.50 Legend ≤1.22
Parking/Unit Ratio
Parking/Unit Ratio
----

Instructions

WELCOME!

The King County Right Size Parking Calculator allows you to view estimated parking/unit ratios for multi-family developments throughout urban areas of King County, WA (Seattle area). The calculator is based on a powerful model developed from current local data of actual parking use. While it is intended to help support and guide parking supply and management decisions, it should not be viewed as a definitive answer. Rather, it should be seen as a resource to inform discussions, weigh the factors impacting parking demand, and help consider the proper provision of parking.


FIND YOUR AREA

Enter a location above or use the zoom and pan tools on the map. To select parcels, you must zoom in close enough to see individual parcel boundaries. Once you’re close enough, the selection tools in the upper right of the map will become active.


SELECT YOUR PARCEL(S)


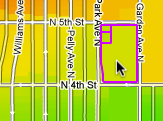
Click the “Select” button and click on the parcel(s) you’d like to inspect. You will see a parking/unit estimate appear in the box above. To unselect a parcel, click the parcel a second time and then click “Remove parcel.”

To select a larger area:

Neighborhood or City: Use the “Select Area” drop down

Custom Area: Click the “Draw” button and create a custom area to select parcels. As you are selecting parcels, the parking/unit estimates will assume one building (as defined in the Building and Parking Specifications tab) on each parcel. If you wish to build one building on multiple parcels, click the “Merge” button.


CREATING SCENARIOS

Once you have selected the parcel(s) of interest, you have the option to click through the “Building and Parking Specifications” and “Location Characteristics” tabs to adjust the default inputs.

Be sure to view the Optimized Parking Supply and Market Price section to help you develop your scenario. This is meant to help users find the right balance of parking supply and parking price for the building composition and location.


VIEW RESULTS

Parking/Unit Ratio: The box above will show the estimated parking spaces per residential unit for the selected building(s), called the parking/unit ratio. When multiple parcels are selected, it will show an average. To view additional information about the selection, click the down arrow in the purple box.

Parking Impacts: This tab provides average parking construction costs and estimated vehicle miles traveled (VMT) and greenhouse gas (GHG) emissions based on the amount of parking.

Selection Info: Click the up arrow in the bottom right for trip generation reduction estimates and Census data on average commute distance and journey to work mode split.

Note: Areas of the map without the Parking/Unit Ratio thematic color map are outside of the model’s geographic coverage.

Building & Parking Specifications

The preset values below represent subregional (CBD, Urban and Suburban) average/median values (from field work) for building (with no affordable units) and parking specifications. These represent the default values, as a starting point, for which parking use ratios are estimated. Scroll down to view parking optimization estimates and guidance on unbundled and affordable housing options.

Number
of Units
Average
Rent ($)
Residential
Area (SQ FT)
Studios:
1 Bedrooms:
2 Bedrooms:
3+ Bedrooms:
Total:
Affordable Units:
Parking
Parking Stalls:
Price per Stall ($/mo):


Optimized Parking Supply and Market Price

Modeled parking utilization per building is nn parked cars and this estimate has a range of nn - nn cars per building.

-- stalls is the optimal parking capacity priced at --/mo.

Optimal pricing for xx stalls is estimated at xx/mo per stall.

show detailed graphs »

How can unbundled (priced) parking influence parking/unit ratios?

The parking/unit ratios below are calculated using preset unbundled parking prices based on parcel location and rent adjustments resulting from unbundling.

Price of Parking Per Stall
Adjusted Average Rent
Avg. Monthly Cost to Resident (rent+parking) Resulting Parking Ratio
Bundled Parking = $0
Unbundled Parking =

How do affordable units with unbundled (priced) parking influence parking/unit ratios?

Price of Parking
Per Stall
Level of Affordability Resulting Parking Ratio
Unbundled Parking =
100% of units designated affordable
Unbundled Parking =
0% of units designated affordable

Location Characteristics

Once you have selected a parcel, the values below represent the location characteristics of the parcel(s) you have selected.

Population:
Concentration Low to High
33,000
60,333
84,694
118,675
150,706
0
Select an area or at least one parcel to use this slider.
Population concentration similar to:
Issaquah
Population concentration similar to:
Eastgate, Factoria or Fauntleroy
Population concentration similar to:
Lake City
Population concentration similar to:
Lower Queen Anne
Population concentration similar to:
First Hill
Jobs:
Concentration Low to High
21,967
89,176
142,372
236,818
305,183
0
Select an area or at least one parcel to use this slider.
Job concentration similar to:
Kent East Hill
Job concentration similar to:
Downtown Bellevue or Fremont
Job concentration similar to:
Eastlake
Job concentration similar to:
Broadway
Job concentration similar to:
Seattle CBD
Transit Service:
Concentration Low to High
990
1,173
1,352
1,523
1,680
0
Select an area or at least one parcel to use this slider.
Transit service concentration similar to:
East Renton Highlands
Transit service concentration similar to:
Crossroads or Burien City Center
Transit service concentration similar to:
University District or Lower Queen Anne
Transit service concentration similar to:
Seattle CBD
Transit service concentration similar to:
3rd Ave/Tunnel Corridor in Seattle CBD

Parking Impacts

Impact Estimated Utilization
(From Model)
Compared To
(User Input)
Estimated Parking Use Ratio:
--
Total Stalls:
-
-
Surface Parking    
Total Capital Costs (Land & Construction):
-
-
Monthly Costs per Residential Unit (including O&M):
-
-
Annual GHG Emissions from Construction and Maintenance (kg CO2e):
-
-
Structure Parking    
Total Capital Costs (Land & Construction):
-
-
Monthly Costs per Residential Unit (including O&M):
-
-
Annual GHG Emissions from Construction and Maintenance (kg CO2e):
-
-
Estimated Annual VMT of Building Residents:
-
-
GHG Emissions from Vehicle Use of Residents (kg CO2):
-
-

Trip Generation Reduction: -%      Average Commute Distance: - miles 
Mode Split for Journey to Work: 
Drive Alone
Carpool
Public Transit
Walk, Bike
Taxi, Motorcycle, or Other
Work at Home
Selection Info

  Map is loading...

  Processing parcels...