Parking Supply and Price Optimizing
Why does parkng supply matter?
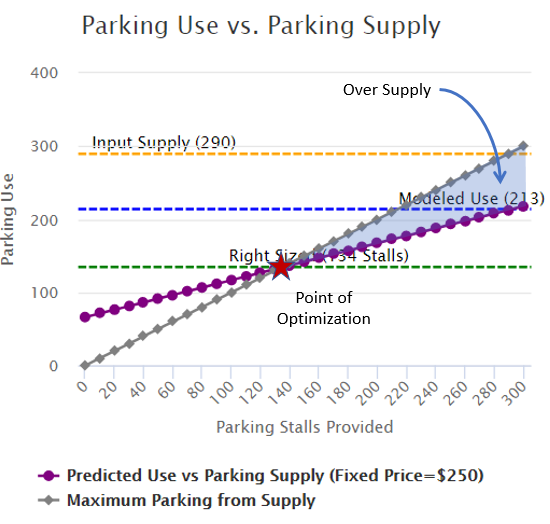
“Si tu id aeficas, ei venient” - “Build it and they will come” – the ancient Latin phrase is appropriate for off street parking in multiunit buildings. The supply of parking stalls available in a building is very influential on parking utilization. Just as the phrase suggests, the more stalls available the more stalls will be used. The data collected at the surveyed sites included the number of parking stalls supplied to building residents. Analysis of this data shows that the number of stalls used by parked cars is strongly determined by the supply. However it is not a one-to-one relationship. Thus the calculator estimates the number of parked cars given the supply (and other variables), and if you change the supply the estimated usage will also change.
For example, if the user enters 290 stalls supplied, the calculator (given the location and the building's makeup) estimates the usage at 213 parked cars. If the user then changes that supply to 213, the calculator may return 174 stalls will be used; change the supply to 174 and it returns 154, and on and on, until the two match. In this example when the supply is set at 134 the utilization is 134. This process has been streamlined and displayed in the "Optimized Parking Supply and Market Price" section below the update buttons on the tool. This helps users find the “supply sweet spot,” or point of optimization, where the supply is just enough so that the calculator estimates that all the available stalls will be used. The following figure illustrates this.

Why does parking price matter?
The cost of parking to the residents of a given building is a factor in parking utilization; the higher the price the lower the utilization. Unlike supply, the price relationship is not self-reflexive. Once the user sets the price for a given building and location, the estimated utilization will be set, if the user then changes that price the utilization estimate will change. In general a lower price results in larger utilization. However, there is a point where lowering the price will still not result in enough utilization to fill all of the supplied stalls, or it may result in an over demand for parking - either way the situation is not optimal.
If for example (Example #1) the supply is set at 200 stalls, and the price at $250 per month per parked car, the utilization is estimated at 194 parked cars (again, given the location and the building's makeup). Lowering the price to $100 per month results in 202 parked cars, and so on, until the price is eliminated altogether, then the utilization may be 216 – more than the supply – showing that the underlying demand for parking will exceed the supply if it is free! Parking is never free the cost is bundled into the rent, often called "Bundleld Parking." However, if the price is set at $130 per month the utilization is estimated at 200 - the same as the supply! This price, the one that matches the supply with the utilization, is termed the “Market Price.”
The following graph illustrates Example #1.

In another location (Example #2) with the same supply and price the utilization is estimated at 153 parked cars; lowering the price to $100 per month results in 162 parked cars, and so on, until the price is eliminated altogether, then the utilization in this location is estimated at 176 - quite a bit less than the supply – showing that the underlying demand for parking is not enough to fill those 210 stalls, even for Bundleld Parking! In this case there is no “Market Price,” since the supply is simply too large.
The following graph illustrates Example #2.

How to match supply and utilization?
There is a circular relationship between parking supply, price and utilization. Therefore it is a little tricky to get the right combination of inputs in any situation that will result in efficient use of building space and/or constructions cost. However, the button allow the user to pick the parking supply that will result in the right size given the price entered in the building decscription.
See How to Use the Calculator for more information.

